PaKon – Network monitoring⚓︎
What is Pakon?⚓︎
PaKon is a tool for monitoring the activity of devices inside a local network. It collects and stores information about network activity and allows you to view and filter records.
Details⚓︎
PaKon utilizes Suricata – IDS/IPS solution. Part of Suricata is Deep Packet Inspection (DPI), which is being used. Suricata does the heavy lifting of analyzing raw network traffic and provides processed information (about flows, DNS requests and responses, HTTP, TLS details, etc.) to our system.
Warning
Pakon is not available on Turris Shield. Depending on your traffic Suricata could be CPU and memory-intensive. This might in some rare cases (a lot of short connections and speeds above 500 Mbps) affect the throughput of your device.
PaKon collects this data from Suricata, puts different pieces of information together, and stores them in an SQLite database (located at folder /srv/pakon). The primary data contains information about each individual network flow including human-readable names of destination addresses. This hostname should correspond to the actual perceived name of that host. The name is obtained by monitoring DNS queries/responses before starting that flow, or some other application-level name (TLS SNI, TLS certificate CN or HTTP hostname).
Big service providers (e.g. Google, Youtube, Facebook, and Twitter) use a number of different hosts and hostnames to serve their content, so PaKon has a list of domains to merge these: /usr/share/pakon-light/domains_replace/. For example, instead of storing the hostname scontent.fprg2-1.fna.fbcdn.net PaKon simply stores facebook.com. This means that some detail is lost. On the other hand, this dramatically improves readability of output and reduces the amount of stored data, which is essential for a clear representation of network traffic.
The data is further reduced in order to store it longer. Most importantly, individual flows are aggregated. Aggregation simply means that instead of storing many flows of the same host, the flows are merged together for a given time frame. The total number of received and sent bytes is preserved, but some detail about duration and start times of individual flows is lost. The records are kept for 4 weeks, but we have plans to adjust this in the future.
Caution
We don’t recommend to use PaKon with just the small flash memory already included in your router. In fact, excessive writing to the internal memory will lead to it getting worn out and damaged soon. To get the most out of PaKon, it’s best to get either an external drive or even an internal SSD. To setup this external drive easily, use the Storage plugin (in reForis or Foris).
Installation⚓︎
reForis⚓︎
By default, you can find reForis available at IP address http://192.168.1.1; after logging in, go to Package Management and then Packages. Enable Pakon there, click on the button Save and update, and wait a while until all packages are successfully installed. When they are, you will get a notification about that.
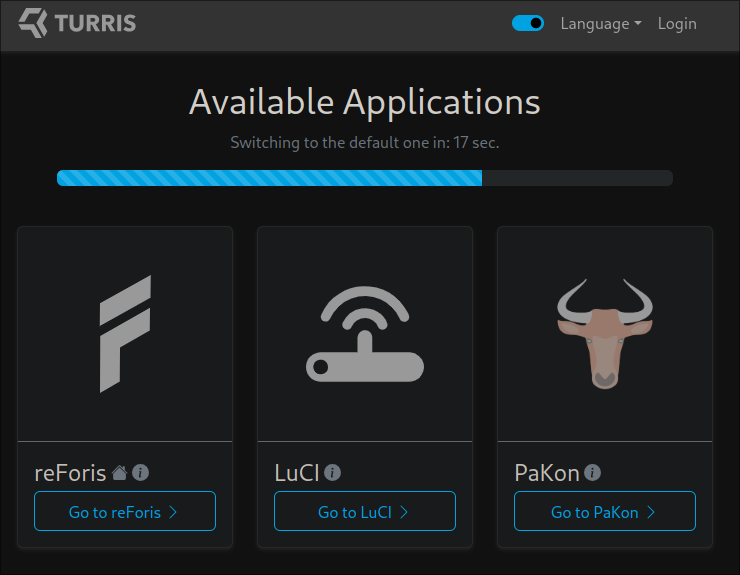
If everything is installed and you will go to the web interface of your router, you will see the option to go to the Pakon web interface.
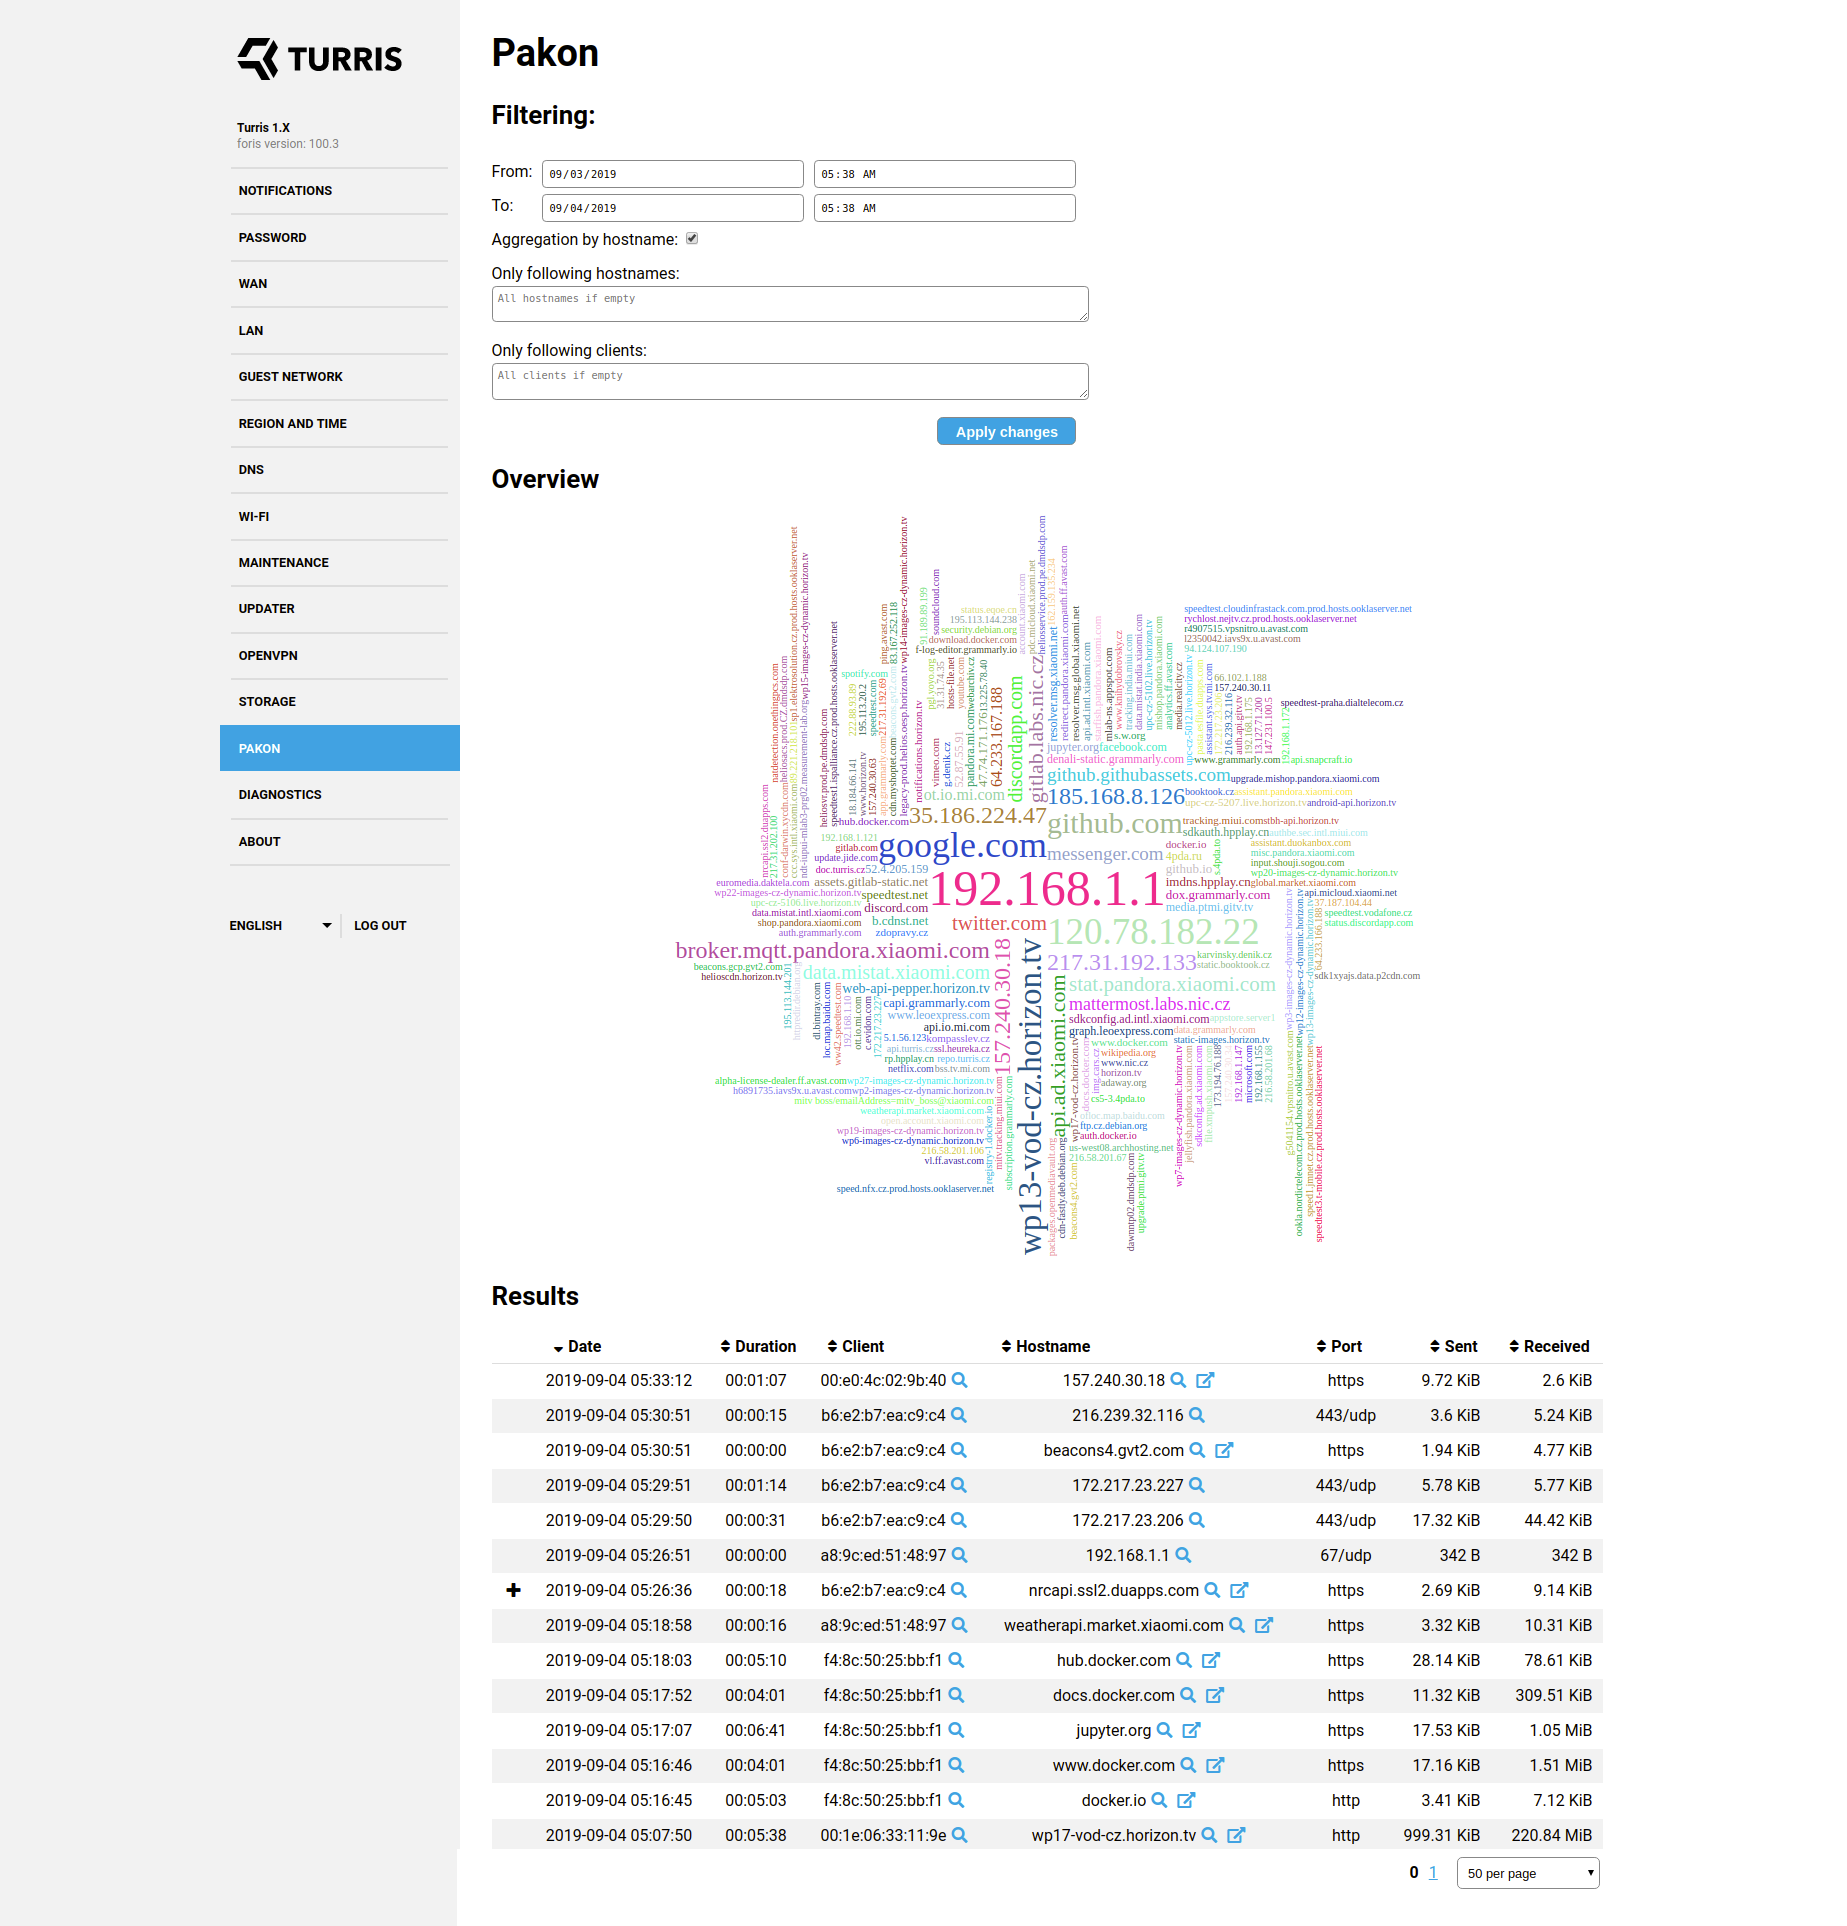
After you select the Pakon web interface, you will see a log of network activity that went through the router. You can browse, filter, or even export it as CSV file.
CLI⚓︎
Connect to your router via SSH and run these two following commands.
opkg update
opkg install pakon foris-pakon-plugin
This should perform all necessary steps needed to start collecting data. Installing two packages pakon and foris-pakon-plugin, starting Suricata (on local and guest network) and monitoring daemons. It may take a while before data is complete enough to be displayed.
Usage⚓︎
The command for displaying PaKon data is called pakon-show. When you run the command, it will produce it will produce an output similar to the following:
$ pakon-show
|datetime            | dur   | src MAC           | hostname                                    | dst port  | proto | sent   | recvd |
|                    |       |                   |                                             |           |       |        |       |
|2019-09-04 03:37:42 | 81s   | 00:01:02:03:04:05 | google.com                                  | 443/udp   | ?     |  35KiB | 419KiB|
|2019-09-04 03:38:13 | 73s   | 00:01:02:03:04:05 | facebook.com                                | https     | tls   |  10KiB | 148KiB|
|2019-09-04 03:38:48 | 1264s | 00:01:02:03:04:05 | twitter.com                                 | https     |       |  33KiB | 726KiB|
|2019-09-04 03:52:59 | 1079s | 00:01:02:03:04:05 | data.mistat.xiaomi.com                      | http      | http  |  72KiB |  16KiB|
|2019-09-04 03:53:04 | 61s   | 00:01:02:03:04:05 | ...v boss/emailAddress=mitv_boss@xiaomi.com | https     | tls   |   1KiB |   7KiB|
|2019-09-04 05:17:52 | 241s  | 00:01:02:03:04:05 | docs.docker.com                             | https     | tls   |  11KiB | 310KiB|
The output gives the user an idea about the visited hosts with the times of visit and size of the sent or received files in bytes.
Individual indicators:
- datetime = date and time the hostname was accessed
- dur = duration for which the given hostname was accessed
- src MAC = source MAC address or the MAC address of the device, which was used to access the hostname
- dst port = destination port (for well-known services this is shown as service name)
- proto = application level protocol as detected by Suricata
- sent = size of data sent
- recvd = size of data received
There are some options how to filter the output. To see them, use the -h option:
$ pakon-show -h
Some domains are hidden in output by default – for example, advertisements, tracking, CDNs, OCSPs, browser service domains, which makes the output hard to read. You can show all records using the option –no-filter. The lists of filtered domains is in /usr/share/pakon-light/domains_ignore/. If there is a new CDN or you want to group multiple hostnames from the same domain to one, and you would like to share it with others and include it in a new Turris OS release, you can contribute it in the pakon-light-lists repository.
A few sidenotes⚓︎
- In some cases, application level protocol is unknown –
?. It can happen in case of failed connection or unrecognized protocol. In those cases, you can still get some idea about it from the destination port. - Web pages commonly include content from multiple domains, which means that visiting one web page results in many flows to different domains.
- Web pages often include content from Google, Facebook, and other such sites. If you see Facebook in the PaKon output, it doesn’t necessarily mean that you visited Facebook, you might have just visited a page that includes Facebook content.
- Duration of flows might be misleading, this is the duration of the connection (time between opening the connection and closing it). That doesn’t mean that the connection was active the whole time. We observed that browsers typically keeps the connection open for few minutes, even though we just made one HTTP request in the first few seconds.
FAQ⚓︎
Where is the data stored?⚓︎
The most recent data is stored in the RAM and backed up in compressed form to persistent storage before restart or every few hours. Data older than 24 hours is aggregated and moved to a persistent archive database.
Where does PaKon get the hostname?⚓︎
PaKon monitors DNS answers and pairs names with IP addresses. When it later sees a flow to a paired IP address, it uses the name that the IP address was paired with.
Even if the DNS query was not performed (eg. when name/IP mapping is hardcoded in the hosts file), Suricata is often able to determine the name from application protocol – in case of HTTP and TLS. HTTP sends hostname as its header. TLS is encrypted, but when the connection is opened (during TLS handshake), client sends the name of server (TLS SNI) and server sends it’s certificate. These are both sent unencrypted, so Suricata can read it even though the data flow is later encrypted.
In case of other protocols, the detection relies just on DNS names. Also note that tunneling protocols (VPNs, SSH, proxies, Tor) can hide the activity entirely – you will only see the flow to the proxy/gateway and not the actual traffic underneath. There is nothing that can be done about that.
Is it possible to have client names instead of their MAC addresses?⚓︎
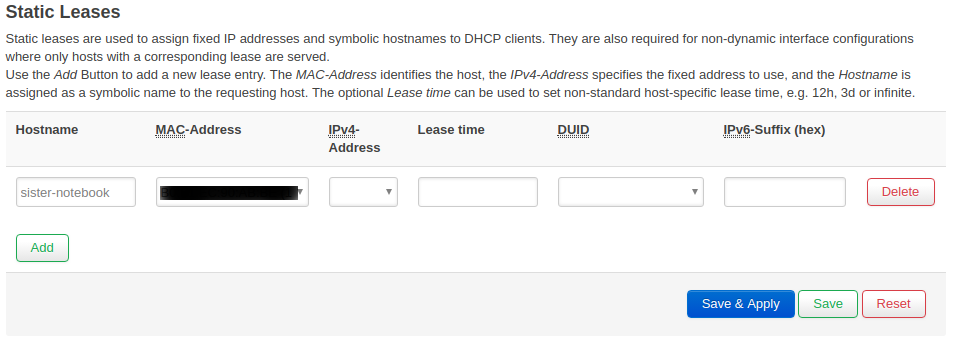
Yes, you need to do it in the advanced administration interface LuCI. From the menu in Network and choose DHCP and DNS. In the tab menu, you should see Static Leases.
You don’t have to set a proper static lease to see names in PaKon – just fill in the name and select MAC address. If you fill in also the IP address, you create a static lease – meaning that the device will always get the same IP address. For more details about static leases click here.
Can I configure the list of monitor networks for PaKon?⚓︎
Yes, you can change the list of monitor networks in configuration file /etc/config/pakon. By default, the list includes two interfaces br-lan and the guest wifi br-guest_turris. Add or edit the interfaces, which you want to monitor and then restart these two services by using the following commands:
/etc/init.d/suricata-pakon restart
/etc/init.d/pakon-monitor restart
Can I clear collected data?⚓︎
There is a way how to do it in the command-line interface. You need to connect to your via SSH and run these following commands, which will stop process pakon-monitor, remove two databases – temporary one and persistent and then it will create a temporary database from scratch.
/etc/init.d/pakon-monitor stop
rm /var/lib/pakon.db
rm /srv/pakon/*
/etc/init.d/pakon-monitor start